A Pivot Table is a tool that can help you summarize and analyze email data; it allows you to see patterns and trends in your email analytics that can help you make data-informed decisions to improve future email communications. A Pivot Table is a good option if you are wanting to pull together email data from large communication campaigns that include multiple emails and/or email journeys.
Intelligence Reports: Pivot Tables
Creating Your Pivot Table
- On the homepage of Marketing Cloud, navigate to Analytics Builder and select Intelligence Reports.
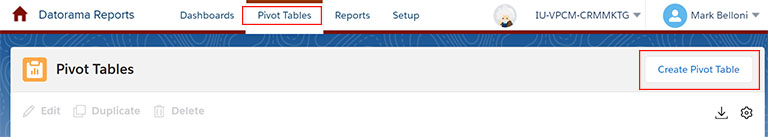
- Within Intelligence Reports navigate to Pivot Tables.
- In the top right corner, select Create Pivot Table.
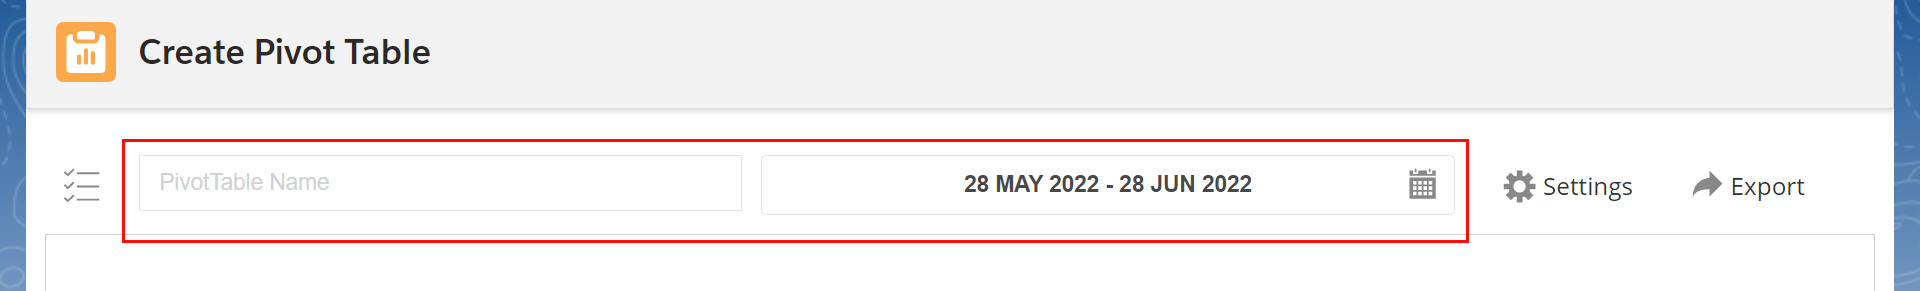
- Name your Pivot Table.
- Select the time frame you want to look at for your analytics.
Define your Dimensions and Measurements
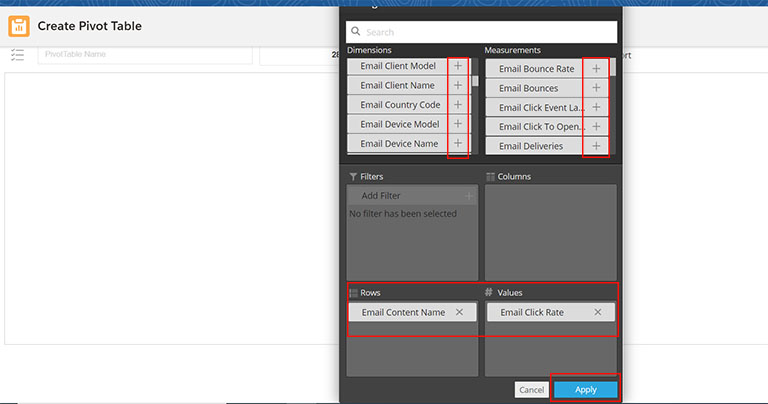
The black Settings box is where you’ll pull in all of the data you want to see in your pivot table. At the top of the box, you'll see that you have the ability to choose both Dimensions and Measurements.
Dimensions are your qualitative non-numerical data points (email names, subject lines, preheaders, etc.)
Measurements are your quantitative numerical data points (open rate, click rate, unsubscribes, etc.)
A detailed explanation of each Dimension and Measurement can be found in this Salesforce article.
Before defining your Dimensions and Measurements, you’ll want to first define your filters. Filters will narrow the scope of your pivot table and will allow you to only view the data that is useful to you. For example, if you wanted to view combined analytics for 5 emails that were a part of a larger 10 email campaign, you would accomplish this by filtering by email name for those 5 emails.
Steps to define your filters:
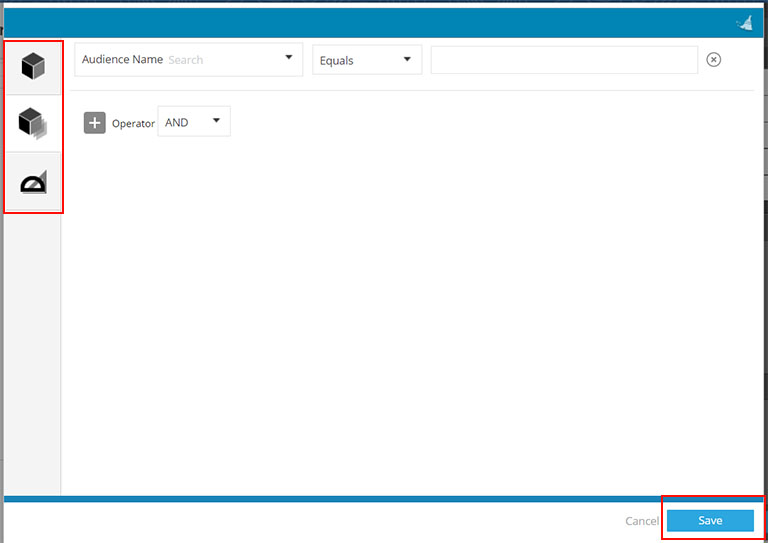
- In the Settings box, select Add Filter. The filtering interface will open.
- On the left hand side, you’ll be able to choose whether or not you want to filter by Dimensions, Custom Dimensions, or Custom Measurements.
- Dimensions allows you to filter by a single dimension. For example, filtering by an email name or journey name.
- Custom Dimensions allow you to filter dimensions using various operators. For example, filtering for all emails that contain “2022” in their name. Custom Dimensions also give you the ability to use AND/OR logic, which allows you to bring in multiple emails and journeys into one pivot table.
- Custom Measurements allow you to filter measurements using various operators. For example, filtering for all emails that have an open rate above 60%.
- Choose your filters and then select Save.
Now that you have chosen your filters, you’ll choose what Dimensions and Measurements you want included in your pivot table. This can be done by either dragging and dropping or selecting the “+” symbol.
Note: If the “+” is used, Dimensions will automatically populate the Rows section and Measurements will populate the Values section (Rows will appear as rows and Values will appear as columns in your pivot table). Depending on how you would like to view your data, you can also drag and drop your Dimensions and Measurements–this allows you to choose whether they are placed in the Rows or Values sections.
After you have chosen your Dimensions and Measurements, select Apply.